
The best-known acceptance-rate data page on the web, American Caldwell's, counts 1,000 US colleges and lands on an average acceptance rate of 64 percent: 107 of its colleges accept nine out of ten applicants, and only 35 accept fewer than 15 percent. Our dataset, 500 universities worldwide, averages 30.6 percent. Neither average is wrong, and neither will tell you whether you will get in. The interesting question is why they are so far apart.
The two datasets measure two different worlds
A census of 1,000 US colleges is full of regional and open-access institutions whose job is to admit most applicants; the average lands high because most colleges are not selective. A global 500 list is built the other way: it overrepresents famous, research-heavy universities that attract far more applications than places. In our data only 148 of the 500 universities publish a rate at all, and publishers skew selective: 48 of the 148 sit below 20 percent, 37 between 20 and 40, 57 between 40 and 60, and just 6 above 60. The mean of 30.6 percent and the median of 29.4 describe that published minority, not higher education as a whole.
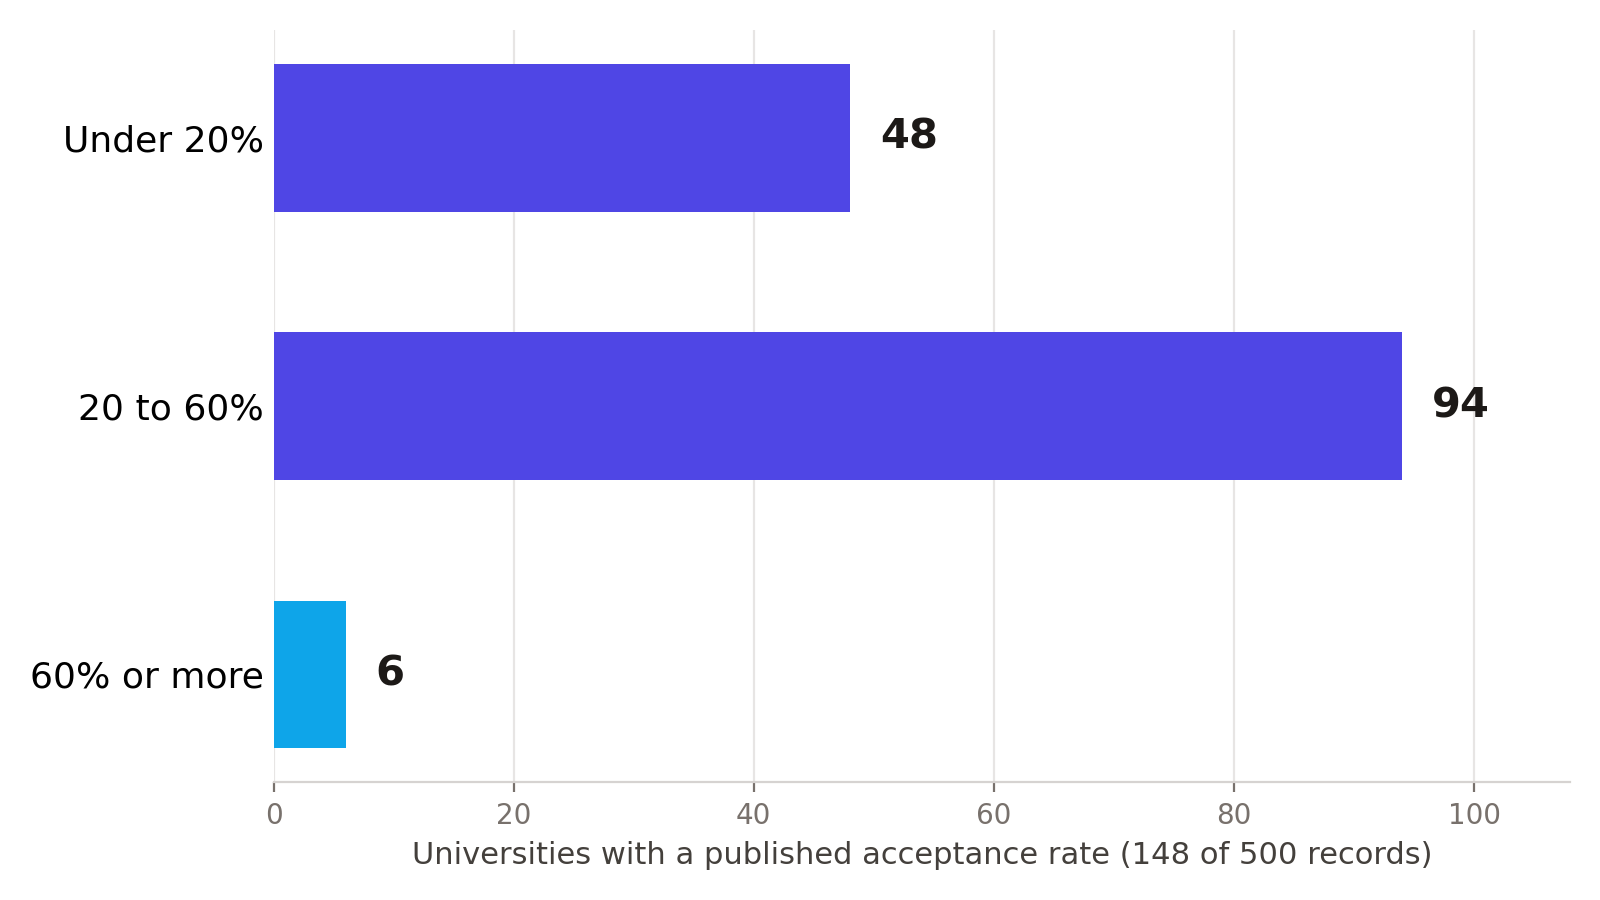
How the rate itself is built
An acceptance rate is admitted students divided by applicants, for one cycle. Everything that moves either side moves the rate. Application volume is the big lever: a university that markets itself to more applicants, joins a common application platform, or waves a famous name collects applications faster than it adds seats, and its rate falls without its teaching changing at all. Self-selection pushes the other way at open universities, where mostly qualified students bother to apply. The same institution can therefore post a falling rate while getting easier to enter for a well-matched applicant, a trap our guide to reading rates university by university takes apart.
What to use instead of the average
Use the band, not the mean. Below 20 percent is a reach for almost everyone; 40 to 60 percent is where realistic matches live; above 60 percent, the six universities in our data that qualify are listed in our by-country map. Then check the two things a rate never shows: the entry scores of admitted students, and whether the university publishes a rate at all, because silence is information too. The Balanced Shortlist Builder sorts our 500 by exactly those fields, rate, average GPA and international tuition where they exist, and labels the gaps instead of filling them. For what calculator apps can and cannot infer from these numbers, see our calculator apps comparison.