
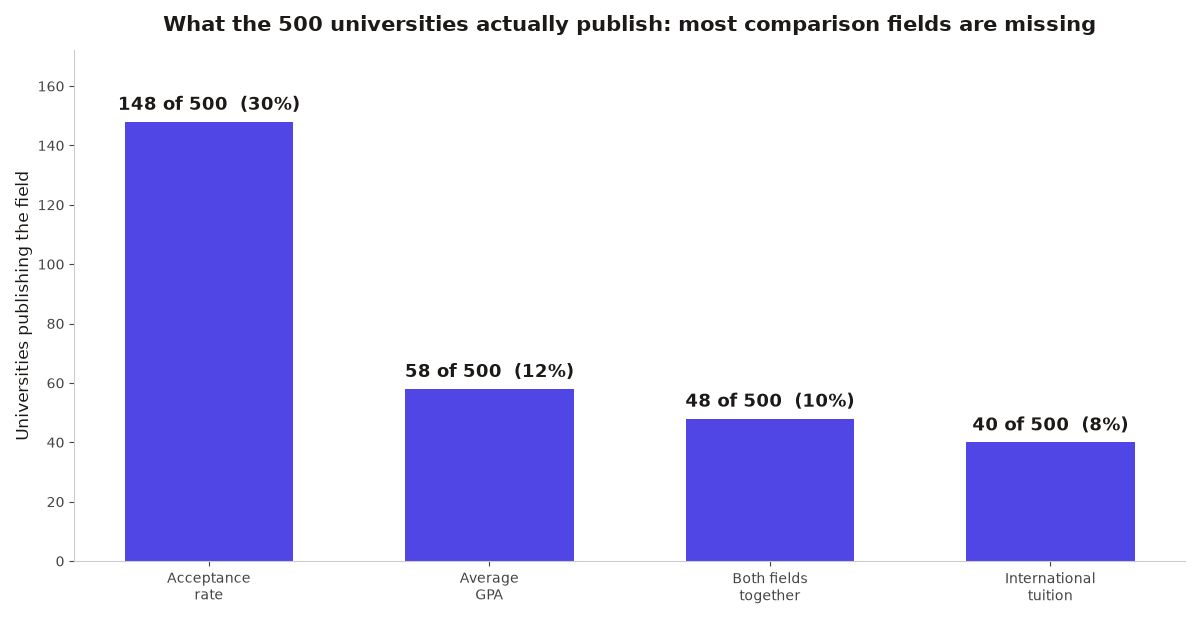
Seven mistakes students make comparing university admission requirements by country, and the zeroth mistake underneath all of them: assuming the numbers exist. In our dataset of 500 universities, only 148 publish an acceptance rate, 58 publish an average admitted GPA, 48 publish both, and 40 publish an international tuition. Most comparisons are built on fields that were never filled in.
The seven mistakes
- Comparing unlike rates. A US acceptance rate and a UK offer rate are not the same number. The US reports admits over applicants; UCAS reports offers, and one applicant collects up to five. Compare within countries, not across them.
- Using the domestic rate as your rate. At many US schools the international rate runs well below the headline figure, while in the UK it often runs above it, because international fees fund the place. The headline is an average of other people's chances.
- Assuming one English score works everywhere. The UK and Germany usually want IELTS 6.5 with no band below 6.0; US programs often want TOEFL 100. A 6.0 in writing sinks a UK application that a 7.0 average would otherwise carry.
- Reading your GPA on the wrong scale. An 8.0 CGPA is not a US 3.0, and German universities convert it to roughly 2.3 on their own scale. Get the WES or uni-assist conversion before you shortlist, not after.
- Missing the country-specific paperwork. Germany wants the APS certificate for Indian applicants. The UK wants one personal statement for five UCAS choices. The US often wants a credential evaluation. Each takes weeks, and none can be rushed.
- Comparing tuition and ignoring the clock. A three-year UK degree at a lower yearly price can cost less all-in than a four-year US degree, and Germany's zero tuition still comes with a blocked account of around 11,208 euros. Do total cost, not sticker price.
- Running on one country's calendar. UCAS closes in January, most US deadlines fall between November and January, and the German winter intake closes around mid-July. Miss the window and your acceptance rate is zero, whatever the brochure said.
The mistake underneath: comparing missing numbers

Even a student who avoids all seven can still be fooled by coverage. With only 48 of 500 universities publishing both a rate and a GPA, the classic comparison, "their average admit looks like me," is impossible for nine universities in ten. There is a subtler version of the same trap: comparing a rate from one year with a GPA from another, or a rate for all applicants with a GPA for one faculty. Universities publish these fields in different documents, in different years, for different cohorts. Placed side by side in one row of a spreadsheet, the row looks precise. It is a collage.
Coverage also varies by country in ways that flatter some systems and hide others. In our data, every Brazilian and Russian university publishes a rate, while none of the German, Chinese, or Dutch ones do. A student comparing a Brazilian rate with a German absence may read the absence as exclusivity. It is usually just a reporting culture: centralised public systems publish, decentralised ones often do not. Absence of evidence is the most common figure in international admissions, and the least discussed.
The honest tools say so. Our Balanced Shortlist Builder classifies only what the data supports and labels the rest plainly, and our explainer on average acceptance rates at UK universities for international students shows how much interpretation a single country's number needs. Compare what is published, flag what is not, and never let a spreadsheet's confidence exceed its coverage.
None of this argues against comparing. It argues for comparing like an auditor: same definitions, same populations, same year, and a note wherever a figure is missing. Do that, and college acceptance numbers become what they should be, one input among several, instead of a horoscope with decimals.
A practical habit helps: for every number you put in a comparison spreadsheet, add a column for its source and year, and a second column that simply says published or estimated. Rows full of estimates are not useless, but they should look different from rows of published fact, because they are different. Most bad shortlists are just spreadsheets where the two were never distinguished.
Sources: Common Data Set, College Navigator